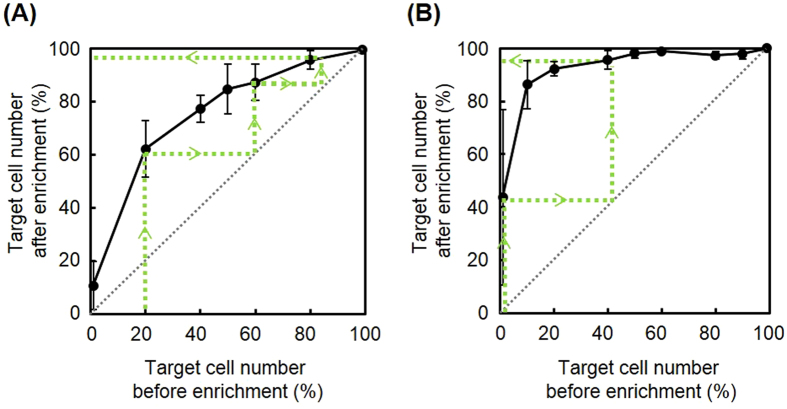
Figure 6. Separation curve of target cells.
(A) Ratio of Hep G2 (targets) to HNDFCs or (B) ratio of Hep G2 (targets) to normal human hepatocytes before and after separation using the aptamer-SAM. Broken lines with arrows indicate a theoretical example of multistep enrichment. The values and error bars indicate mean and standard deviations calculated from three independent experiments.

