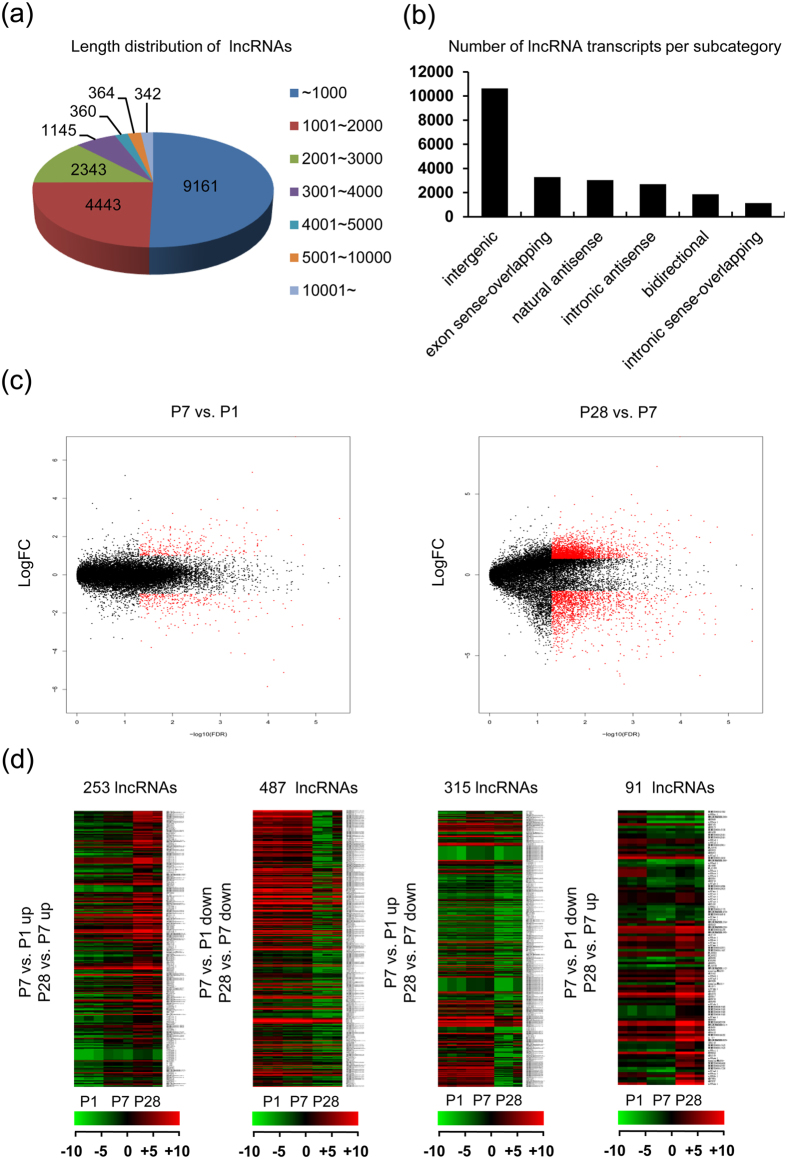
Figure 1. Global description of lncRNAs expressed in neonatal mouse heart.
18,158 lncRNAs were detected by using microarray technique. (a) The pie chart shows the length distribution of lncRNAs. (b) The Number of lncRNA transcripts per subcategory sorted by their positions relative to nearby coding genes. (c) Volcano plot of fold changes and corresponding FDR values for each lncRNA after comparison of P7 and P1 heart (left panel) or P28 and P7 heart (right panel), respectively. The red points represent lncRNAs with fold change ≥2.0 and FDR < 0.05. The black points represent lncRNAs with fold change <2.0 or FDR ≥ 0.05. (d) Heat maps show the hierarchical clustering analysis of the 1,146 differentially expressed lncRNAs with four different expression patterns. Each row represents the same lncRNA and each column represents the same sample. The expression intensity of each lncRNA in one sample is represented in shade of red or green, indicating its expression level above or below the median expression intensity across all samples, respectively. One-way ANOVA for (c and d). (n = 3 samples per time point).

