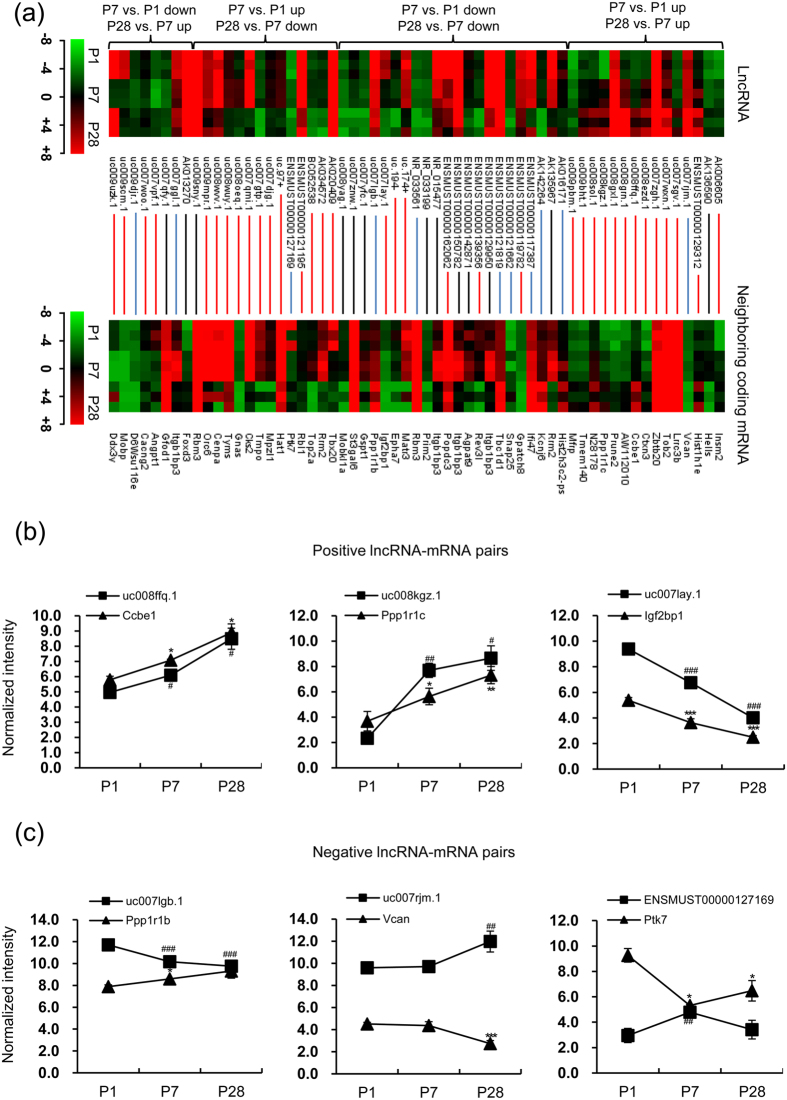
Figure 3. The expression levels of lncRNAs and neighboring gene mRNAs within 300 kb.
(a) Heat maps show the expression levels of 59 differentially expressed lncRNAs (upper panel) and their corresponding differentially expressed neighboring gene mRNAs (lower panel) at three indicated time series. Each row represents one lncRNA (top) or one mRNA (bottom), respectively, and each column represents one sample. Each line indicates a lncRNA-mRNA pair. A red line represents a positive associated lncRNA-mRNA pair and a blue line represents a negative associated lncRNA-mRNA pair, respectively, while a black line means no obvious expression relevance between a lncRNA and its neighboring coding gene. The expression value of each lncRNA in one sample is represented in shade of red or green, indicating its expression level above or below the median expression value across all samples, respectively. (b) The normalized intensity of uc008ffq.1-Ccbe1, uc008kgz.1-Ppp1r1c and uc007lay.1-Igf2bp1 in the microarray data. (c) The normalized intensity of uc007lgb.1-Ppp1r1b, uc007rjm.1-Vcan and ENSMUST00000127169-Ptk7 in the microarray data. #p < 0.05, ##p < 0.01 and ###p < 0.001 vs. P1 for lncRNAs. *p < 0.05, **p < 0.01 and ***p < 0.001 vs. P1 for mRNAs. One-way ANOVA for (b and c). (n = 3 samples per time point).

