
Figure 4. GO and pathway analysis of differentially expressed neighboring coding genes in neonatal mouse heart.
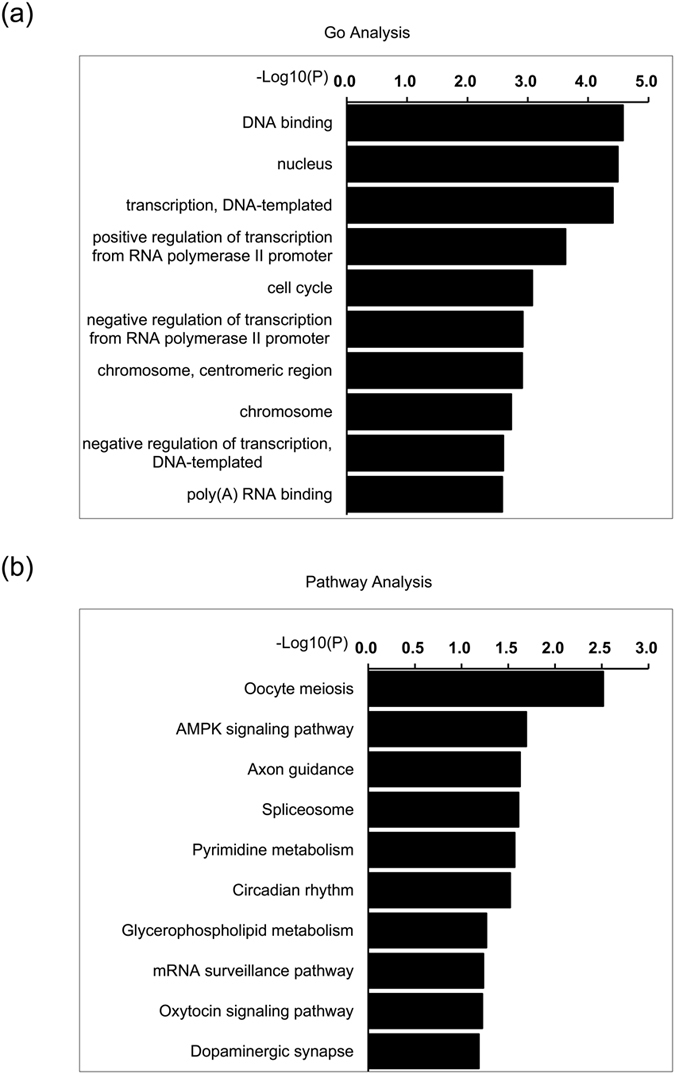
(a,b) GO (a) and pathway (b) analysis of the neighboring coding genes corresponding to differentially expressed lncRNAs. The vertical and horizontal axes represent the biological process/pathways and −Log10 (p value) of the corresponding biological process/pathways, respectively. The top 10 significant involved GO items and pathways (p < 0.001) are shown. Fisher exact test for (a and b).