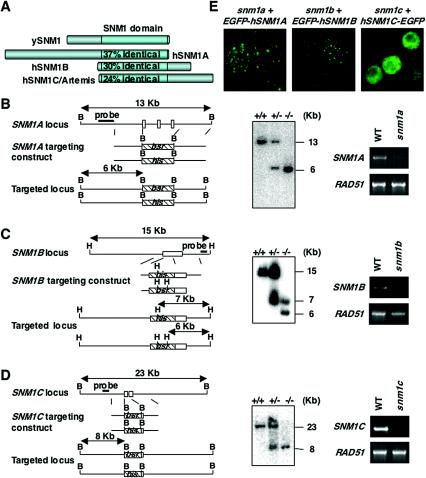
FIG. 1.
SNM1 family genes in vertebrates. (A) Schematic diagrams of SNM1A family. Yeast (y) SNM1 and hSNM1 family proteins are shown. Numbers in the SNM1 domain indicate percentages of identity to the yeast SNM1 domain. (B to D) Targeted disruption of chicken SNM1A (B), SNM1B (C), and SNM1C (D) loci in DT40 cells. Schematic representations of part of each loci, the gene targeting constructs, the configuration of targeted allele, and results of the Southern blot analysis and RT-PCR analysis are shown. White boxes indicate the positions of exons that were disrupted. B, BamHI; H, HindIII. Southern blot analysis was carried out with genomic DNA digested by BamHI (SNM1A and SNM1C) or HindIII (SNM1B) from cells with the indicated genotypes by use of flanking probes. mRNA expression of each disrupted gene or control (RAD51) in wild-type and mutant DT40 cells was analyzed by RT-PCR. (E) Nuclear localization patterns of EGFP-fused SNM1 family proteins in complemented DT40 mutant cells. WT, wild type.

