
Figure 1.
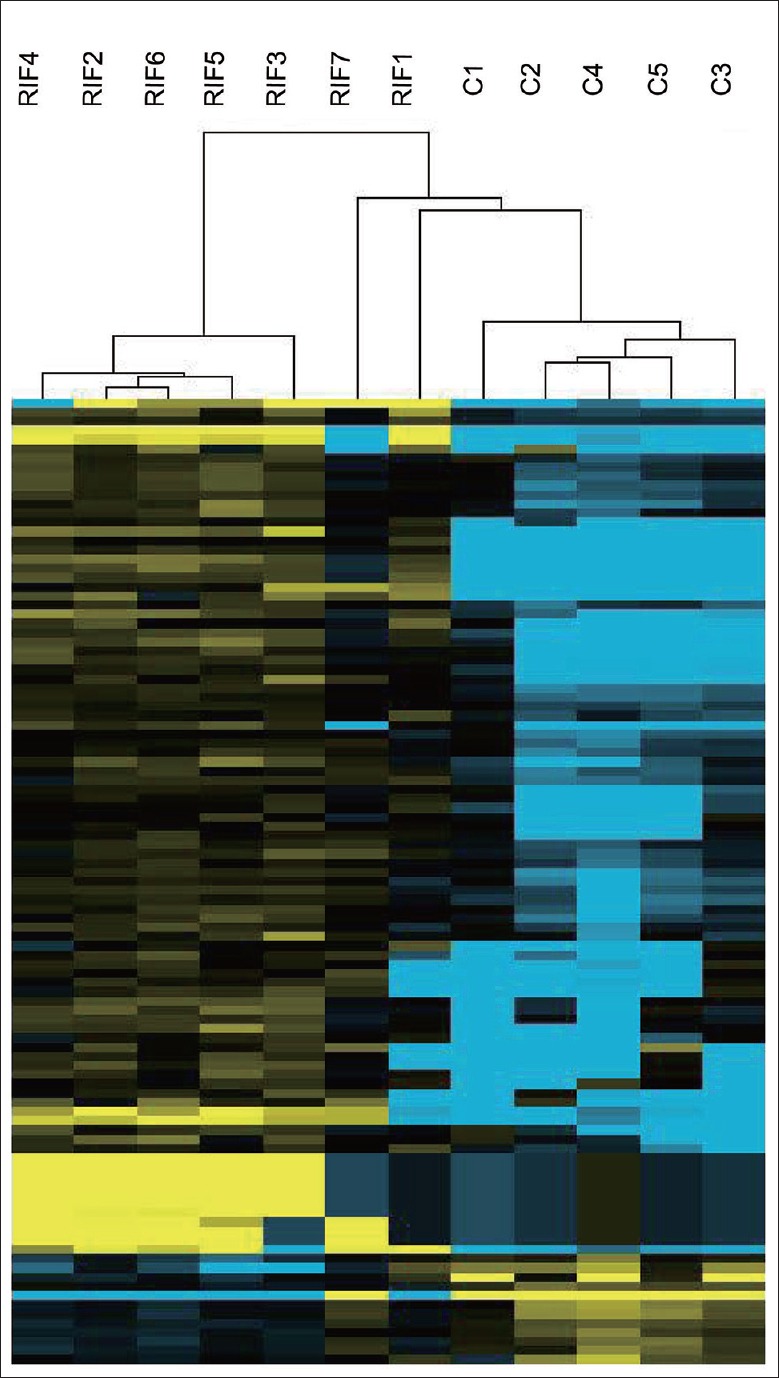
Dendrogram and hierarchical clustering. Expression data from all the differentially expressed miRNAs are analyzed. Each row presents one gene and each column represents an endometrial sample. Column RIF1, RIF2, RIF3, RIF4, RIF5, RIF6, and RIF7 are RIF samples and column C1, C2, C3, C4, and C5 are control samples. Up- and down-regulated miRNAs are, respectively, indicated by yellow and blue, and miRNAs that are lack of significant change are indicated by black. miRNA: MicroRNA; RIF: Repeated implantation failure.