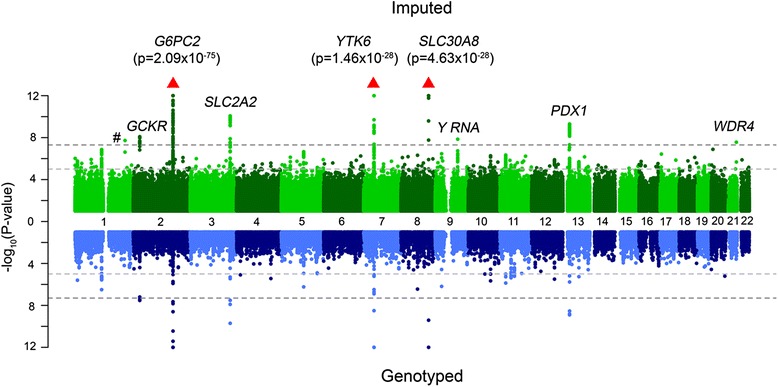
Fig. 1.

Miami plot of fasting plasma glucose. The top panel shows the GWAS results using all SNPs imputed to the HRC reference panel, while the bottom panel shows only directly genotyped SNPs. In the Miami plot − log10 (p value) is plotted on the y-axis and chromosomal location is plotted on the x-axis. The genome-wide significance threshold after correction for multiple testing (p value < 5 × 10⁻⁸) is indicated by a dark grey dashed line, while suggestive significance (p value < 10–5) is indicated by a light grey dashed line. The # symbol denotes a hit in an intergenic region. Red arrows indicate SNPs that are not plotted because they have a high –log10 (p value) (indicated in brackets)
