
Fig. 1.
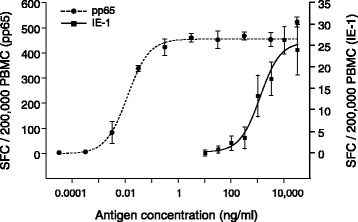
Determination of optimal concentrations of T-activated® pp65 and IE-1 for the stimulation of PBMC. PBMC were isolated from one CMV-seropositive healthy donor blood sample and stimulated for 19 h with increasing concentrations of T-activated® pp65 (31.6 fg/ml-31.6 μg/ml; black circles) or IE-1 (0.01-31.6 μg/ml; black squares). IFN-γ ELISpot results of four replicates are expressed as mean SFC/200,000 PBMC. Error bars represent standard deviations. The Y-axis scale was adjusted to pp65- (left) and IE-1- (right) specific values to optimize data resolution. Curve fitting was made using the four parameter logistic function of GraphPad Prism 5.04