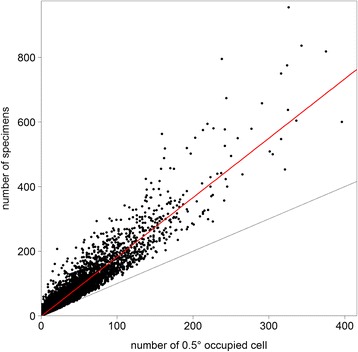
Fig. 3.

Spatial distribution of specimens per species. Each dot represents a species with its number of specimens against the number of 0.5° sampling units (SUs) it occupies. The slope of the red line (linear regression) indicates the average number of specimens per SU for all species. The grey line (slope equal to one) indicates when the number of specimens equals the number of occupied SUs
