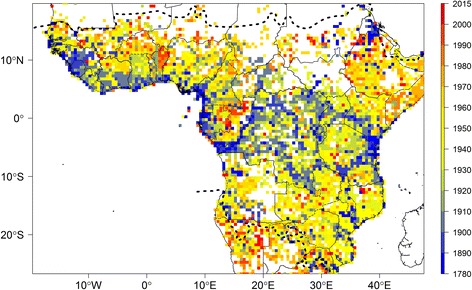
Fig. 5.

Time lapse of botanical collecting history across tropical Africa. The map represents the date of the first botanical collection made within each 0.5° sampling unit. Dashed lines represent the limits for tropical Africa as defined in our study. Map based on georeferenced herbarium records, silica gel samples and plot data. An animated gif version of this map is available at: http://rainbio.cesab.org
