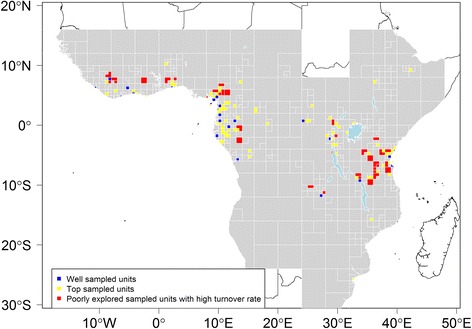
Fig. 7.

Level of botanical exploration across tropical Africa. Based on an adaptive resolution sampling units (SUs). This map shows priority SUs calculated based on a turnover rate using μ = 1°. Grey SUs represent SUs that did not meet any of our threshold limits (see text for explanation) and thus highlight SUs that are poorly documented. Dashed lines represent the limits for tropical Africa as defined in our study. Map based on georeferenced herbarium records, silica gel samples and plot data
