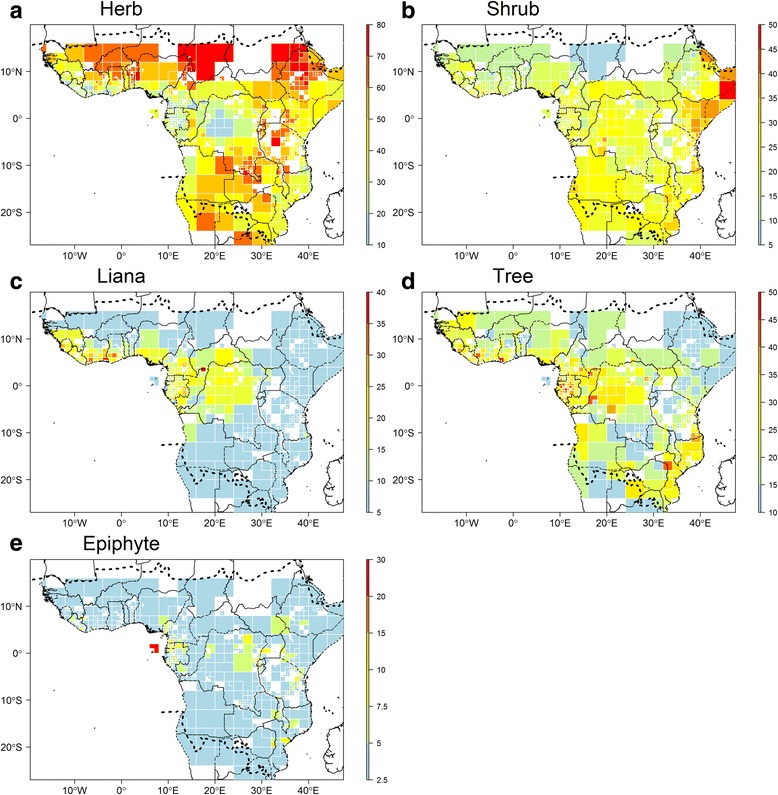
Fig. 8.

Distribution of growth form diversity across tropical Africa. Based on an adaptive resolution sampling units (SUs; for explanation see text). Proportion of species of a given growth form type occurring in each SU. a Proportion of herbs; b Proportion of shrubs; c Proportion of lianas; d Proportion of trees; e Proportion of epiphytes. Dashed lines represent the limits for tropical Africa as defined in our study. Map based on georeferenced herbarium records, silica gel samples and plot data
