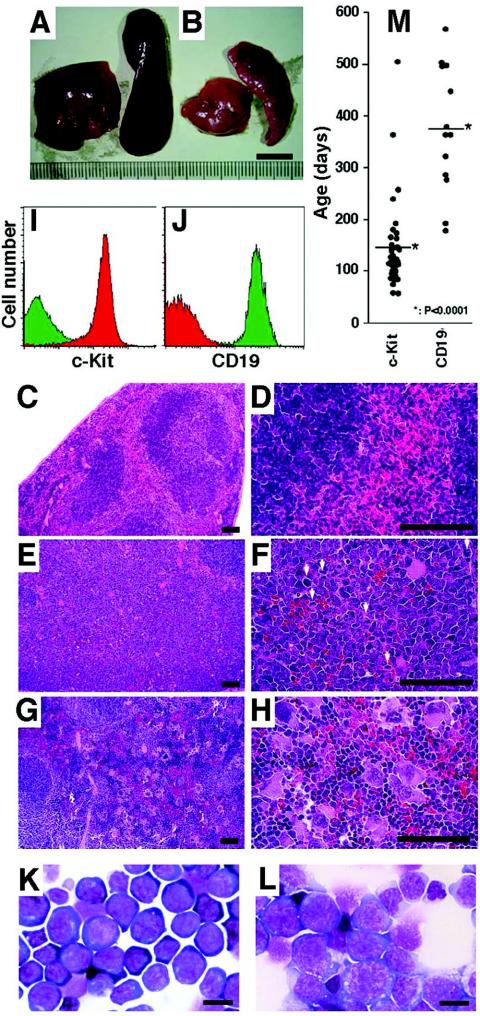
FIG. 3.
Differences between type 1 and type 2 GATA-1.05/X splenomegaly. (A and B) Enlarged spleens and livers removed from type 1 (A) or type 2 (B) GATA-1.05/X mice. (C to H) Histological analyses of the type 1 and type 2 mouse spleens with hematoxylin-eosin staining. Both red and white pulps are observed in the normal control spleen (C and D), but these structures are destroyed in both type 1 (E and F) and type 2 (G and H) enlarged spleens. Whereas proliferating cells with a blast-like appearance are seen in the enlarged type 1 spleen (E and F), megakaryocytes are increased in number with lymphocyte infiltration in the red pulp of the type 2 enlarged spleen (G and H). Mitotic cells are observed in type 1 splenomegaly (white arrows in panel F). Scale bars, 50 μm. (I and J) Typical flow cytometry analysis of mononuclear cells from the enlarged spleens of type 1 (I) and type 2 (J) leukemic mice. Red and green histograms show mononuclear cells positive for c-Kit and CD19 antibody, respectively. (K and L) Wright-Giemsa staining for a cytospin specimen of mononuclear cells from type 1 (K) or type 2 (L) mouse spleens. Blast-like cells are increased in number in both types of spleens. The morphologies of these blast-like cells are completely different between type 1 and type 2 spleens. Scale bars, 10 μm. (M) Ages of onset of type 1 and type 2 leukemias. The average age of onset of type 1 leukemia was 143 ± 82 days, and that of type 2 leukemia was 387 ± 128 days (*, P < 0.0001).

