
Fig. 3.
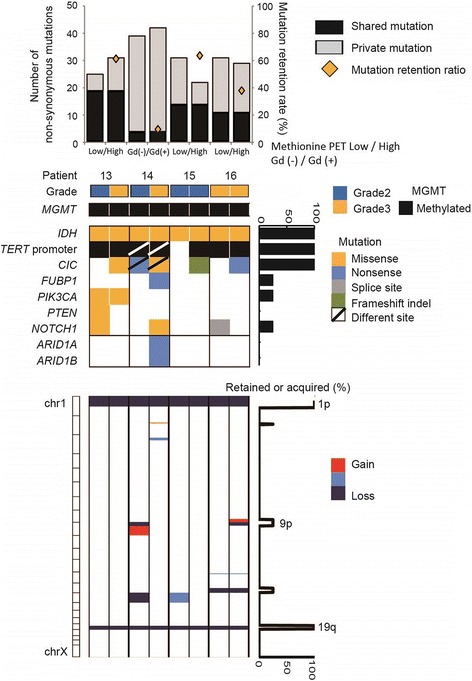
Summary of genomic profiles in different regions of oligodendrogliomas. Mutation and copy number analysis of samples in different regions of the tumor in four patients. The number of non-synonymous mutations, clinical grade, MGMT promoter methylation status, mutation profiles and copy number alterations are shown from top to bottom of the panel. On the right of the panel, the percentage of retained and acquired mutations and copy number alterations are depicted