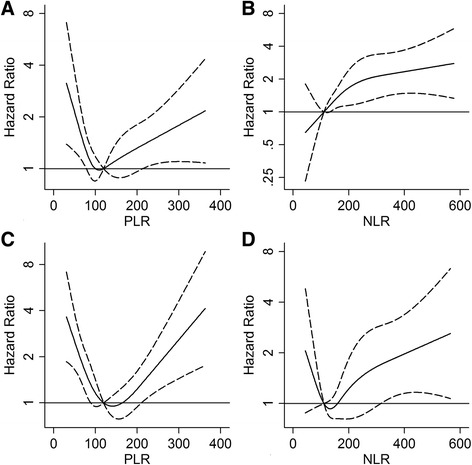
Fig. 2.

Risk of death (Hazard Ratio) according to distribution of PLR and NLR and coinfection status. (a and c) PLR was modeled by cubic spline (solid line) with four knots in Cox regression model adjusted for gender, age, intravenous drug use, AIDS event, CD4 cell count and antiretroviral therapy. The reference value is 120. (b and d) NLR was modeled by cubic spline (solid line) with four knots in Cox regression model adjusted for gender, age, intravenous drug use, AIDS event, CD4 cell count and antiretroviral therapy. The reference value is 1.1. The 95% confidence limits are shown as dashed lines. a and b included subjects without HBV/HCV coinfection, c and d included subjects with HBV/HCV coinfection. Vertical axes have a logarithmic scale. Abbreviations: PLR, platelet to lymphocyte ratio; NLR, neutrophil to lymphocyte ratio
