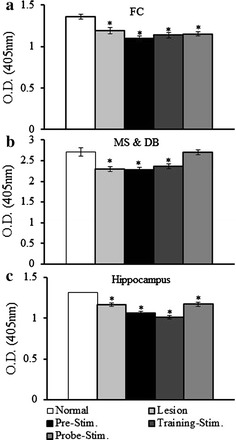
Fig. 5.

Changes in acetycholinesterase (AChE) activity. a AChE activity in the frontal cortex. AChE activity was significantly reduced in the lesion group and all the stimulation groups compared with that in the normal group. b AChE activity in the medial septum and diagonal band. AChE activity was restored only in the probe-stimulation group. c AChE activity in the hippocampus. Hippocampal AChE activity was significantly reduced in the lesion group and all the stimulation groups compared with the normal group. AChE activity was expressed as the optical density at 405 nm (values represent the mean ± SEM, p < 0.05)
