
Fig. 4.
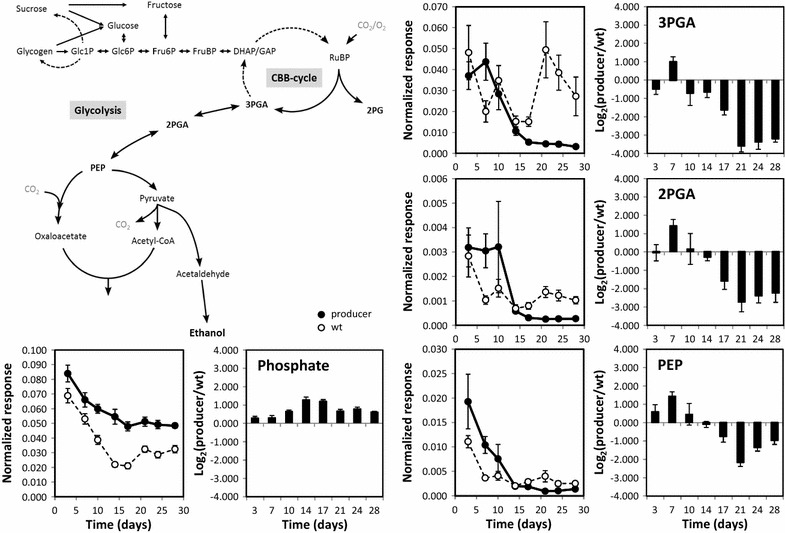
Scheme of glycolysis and major carbohydrate metabolism in relation to ethanol production from pyruvate in Synechococcus 7002. Metabolite data represent internal standard-corrected normalized responses, i.e. pool sizes in arbitrary units per OD−1750 mL−1 of sample, from ethanol producer and WT (left) and differential profiles (right), i.e. log2-transformed ratios of producer over WT at each time point (Additional file 3)