
Fig. 6.
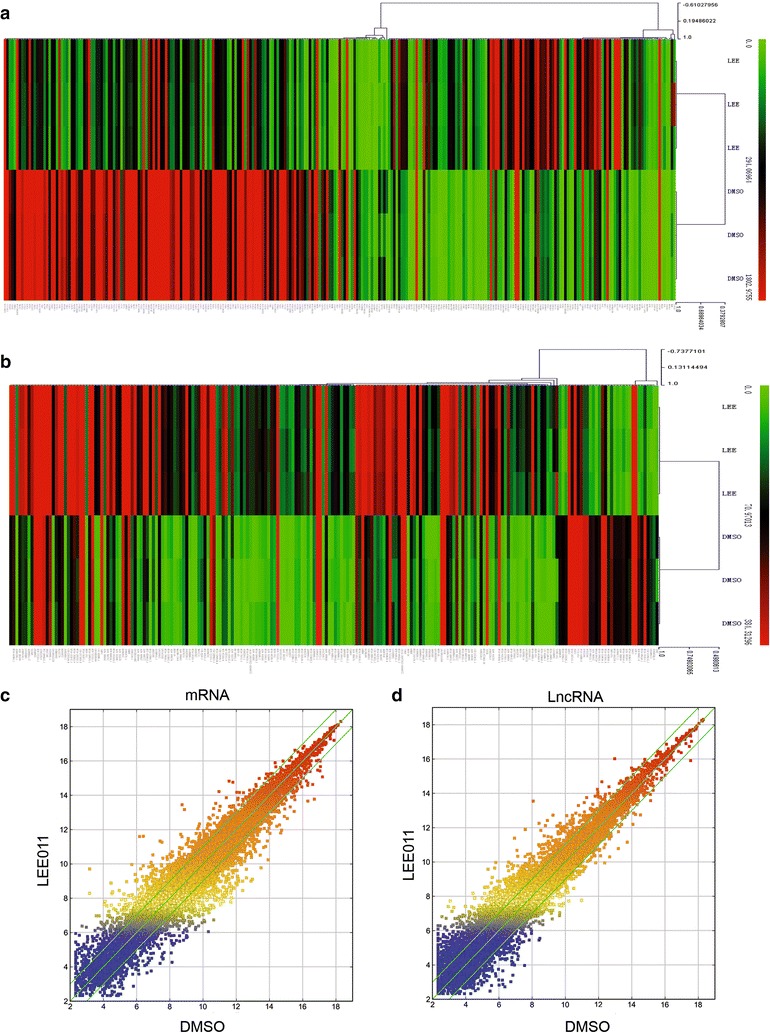
Microarray analysis of gene and LncRNA expression profiles in LEE011-treated HL-60 cells. The Arraystar Human LncRNA 8 × 60 k v3.0 1 microarray was used to identify mRNA and lncRNA expression profiles in LEE011-treated HL-60 cells compared with controls. a Hierarchical clustering analysis of the 116 and 155 significantly up- and downregulated mRNAs (≥fivefold) in LEE011-treated HL-60 cells. b Hierarchical clustering analysis of the differently expressed lncRNAs with a fold-change ≥5 in LEE011-treated HL-60 cells. c Scatter-plot showing mRNA expression variation between the control group and LEE011 treated HL-60 cells. The green lines are fold-change lines (the default fold-change value given is 2.0). d Scatter-plot showing lncRNA expression variation between the control group and LEE011-treated HL-60 cells