
Fig. 9.
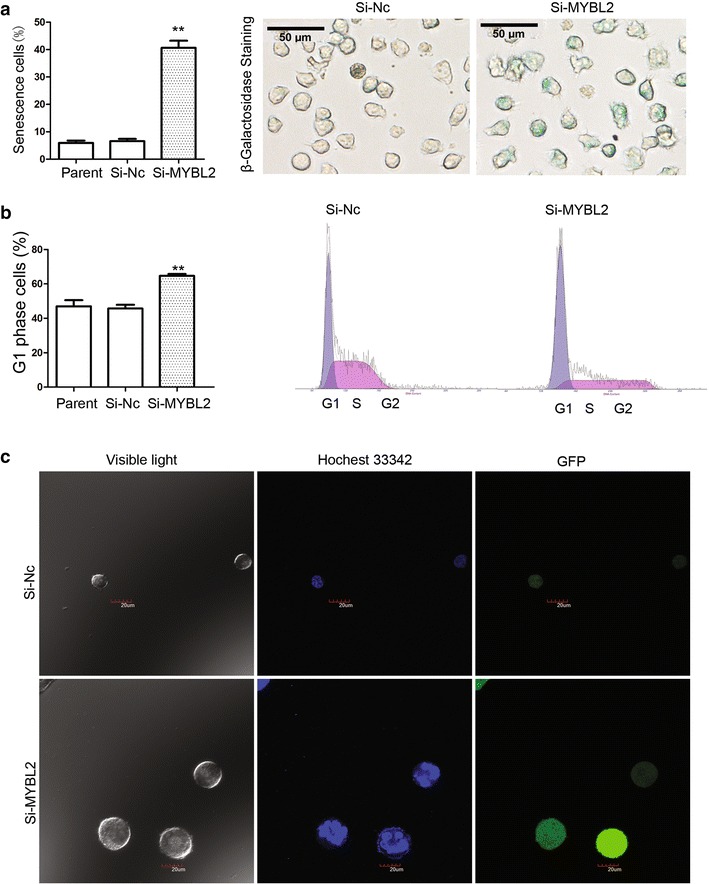
LEE011 induced cellular senescence in leukemia cells partially through downregulation of the transcriptional expression of MYBL2. a Cell senescence β-galactosidase staining analysis showed that in the Si-MYBL2 group, positively stained cells increased compared with the Si-Nc control group: Si-MYBL2 group 40.63 ± 4.48% vs. Si-Nc group 6.57 ± 1.42%, P = 0.003. b Cell cycle analysis showed that G1 phase cells in the Si-MYBL2 group increased significantly: Si-MYBL2 group 64.67 ± 1.98% vs. Si-Nc group 45.73 ± 3.72%, P = 0.004. c DNA staining with Hochest 33,342 showed that nucleus became larger and irregular in the Si-MYBL2 group cells. **P < 0.01