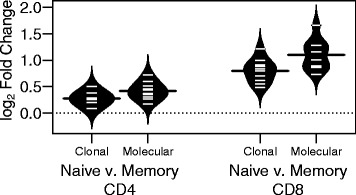
Fig. 4.

T cell repertoire differences are magnified by clonal expansion. Individual naïve and memory CD4+ and CD8+ V gene repertoires were tallied based on either the clonally collapsed (clonal) dataset or the full (molecular) dataset from Rubelt et al. Naïve and memory repertoires were then compared within each individual donor (n = 10), and log-fold change values were estimated from each RDI value. Individual log-fold change values (tick marks) and a kernel density plot (curved line) are shown for each group
