
Fig. 4.
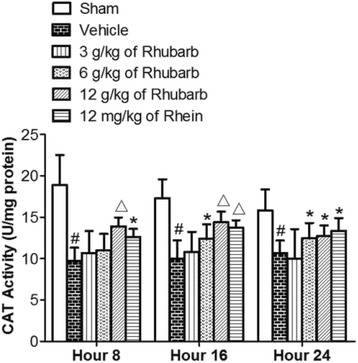
Effects of Rhubarb (3 g/kg, 6 g/kg and 12 g/kg) and Rhein (12 mg/kg) on the CAT levels of rat brains at different time points. Values are expressed as the mean ± SD. # p < 0.01 compared to the sham at the same time point, *p < 0.05 compared to the vehicle at the same time point, △ p < 0.01 compared to the vehicle at the same time point