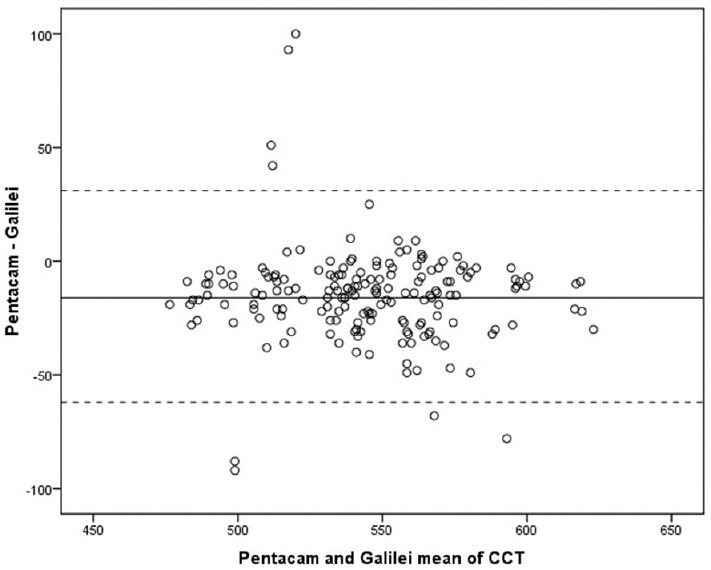
Figure 4.

Bland-Altman plots of central corneal thickness. The dotted lines enclose differences from the upper and the lower 95% LOA (±1.96 SD). The middle line represents mean differences between the results of Pentacam and Galilei values. LOA, limit of agreement; SD, standard deviation.
