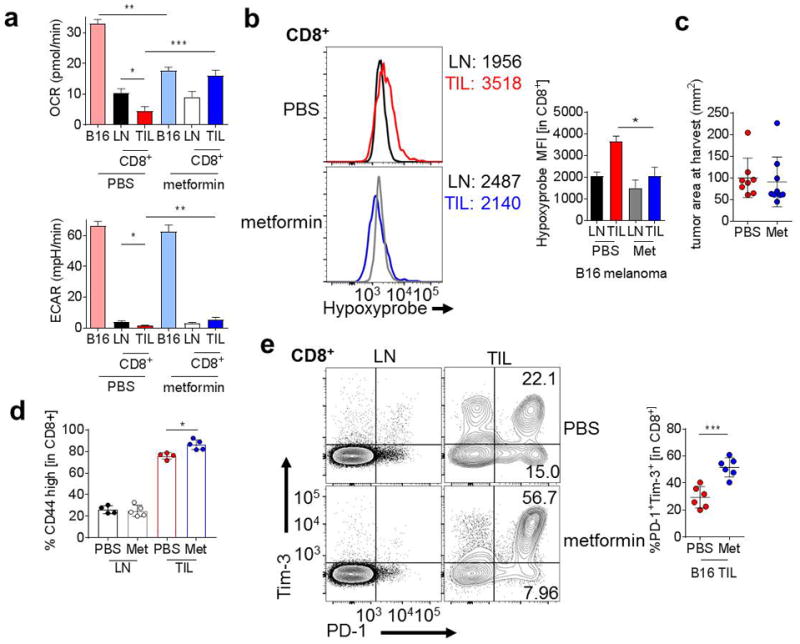
Figure 3. Metformin treatment reduces intratumoral T-cell hypoxia.

(A) Oxygen consumption rate (top) or extracellular acidification rate (bottom) from B16-bearing mice treated with metformin or vehicle for 3 days. CD45+CD8+ T cells were sorted by flow cytometry and assayed directly ex vivo, whereas B16 tumor cells were CD45-depleted before assaying. (B) Flow cytogram (left) and tabulation (right) of pimonidazole staining in T cells from B16-bearing mice treated with metformin or vehicle for 3 days. (C) Tumor area at 21 days for mice treated during tumor progression with PBS or metformin. (D) Quantification of CD44hi CD8+ T cells from B16-bearing mice treated with metformin or vehicle for 3 days (E) PD-1 and Tim-3 expression in CD8+ T cells from mice treated as in D. * P < 0.05, *** P < 0.001 by unpaired t-test. Results are representative of three (A, B, D, E) or four (C) independent experiments.
