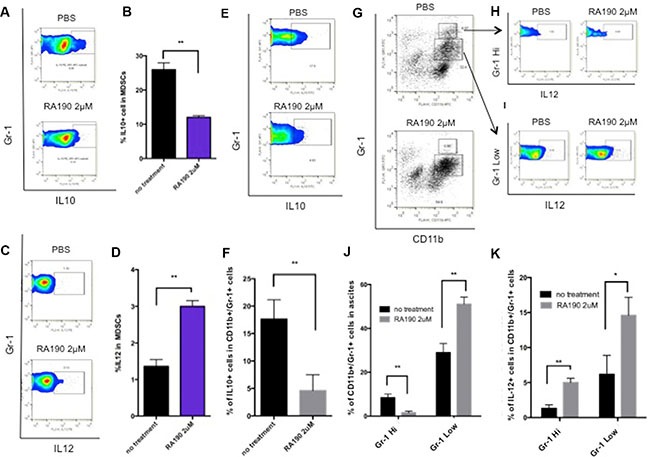
Figure 2. Impact of RA190 treatment upon IL-10, IL-12, and Gr-1 expression in MDSCs isolated from spleen and tumor microenvironment.

(A–D) Splenocytes of ID8-Luc tumor bearing mice were treated with or without RA190 (2 μM) for 48 hours and IL-10 and IL-12 expression were assessed in CD11b+ Gr-1+ cells. (A) Representative flow cytometry of IL-10 in MDSCs in spleen. (B) Bar graph showing IL-10 expression in MDSCs in spleen. (C) Representative flow cytometry of IL-12 in MDSCs. (D) Bar graph showing IL-12 expression in MDSCs in spleen. (E-K) Ascites were collected from the peritoneum of ID8-Luc tumor-bearing mice and treated with or without RA190 (2 μM) for 48 hours, and IL-10 and IL-12 expression levels were examined in CD11b+ Gr-1+ cells in the tumor microenvironment. (E) Representative flow cytometry of IL-10 in MDSCs in ascites. (F) Bar graph showing IL-10 expression level of MDSCs in the ascites. (G) MDSC population distribution after PBS or RA190 treatment. (J) Bar graph showing the percentage of CD11b+Gr-1Hi cells and CD11b+Gr1Low cells among ascites. (H–I) Representative flow cytometry analysis of IL-12 in Gr-1Hi and Gr-1Low MDSC populations. (K) Bar graph showing IL-12 expression in CD11b+Gr1Hi and CD11b+Gr-1Low populations in various treatment groups. Values are shown as mean ± SD (*P = 0.05, **P = 0.01, ns, not significant).
