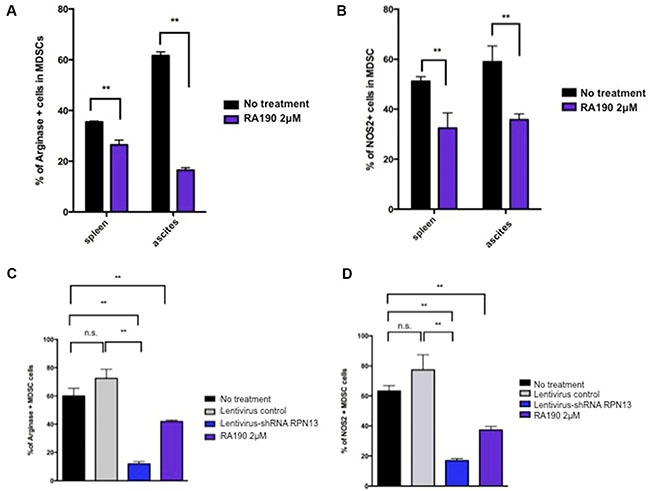
Figure 3. Arginase and iNOS levels in MDSCs isolated from spleen and tumor microenvironment following RA190 treatment or RPN13 knock down in vitro.

(A and B) MDSCs from spleens and ascites of ID8-Luc tumor-bearing mice were treated with or without RA190 (2 μM) in vitro for 24 hours. The levels of Arginase and iNOS were assessed by flow cytometry. (A) Bar graph showing arginase expression in CD11b+Gr1+ cells isolated from spleen and ascites. (B) Bar graph showing iNOS expression in CD11b+Gr1+ cells isolation from spleen and ascites. (C and D) Lentivirus expressing Rpn13 shRNA was used to infect MDSCs and knock down Rpn13 expression. Arginase and iNOS expression in MDSCs receiving no treatment, infected with lentivirus expressing control shRNA, infected with lentivirus expressing Rpn13 shRNA, or treated with RA190 (2 μM) were assessed by flow cytometry. (C) Bar graph showing the percentage of arginase expressing CD11b+Gr-1+ cells in different groups. (D) Bar graph showing the percentage of iNOS expressing CD11b+Gr-1+ cells in different groups. Values are shown as mean ± SD (*P = 0.05, **P = 0.01, ns, not significant).
