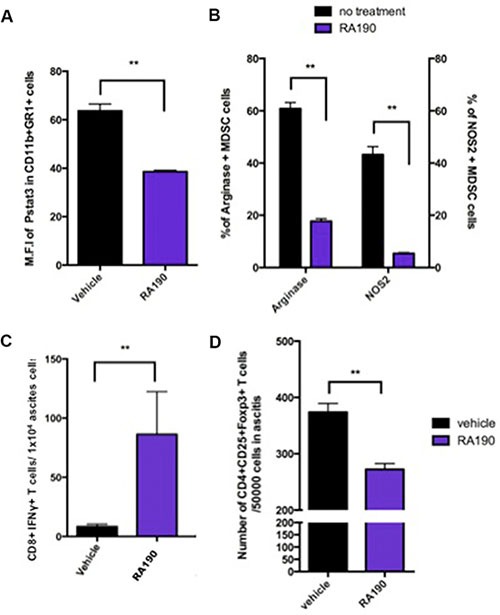
Figure 5. Impact of RA190 treatment upon P-Stat3, arginase and iNOS expression levels in MDSCs, and T cell populations in the tumor microenvironment.

C57BL/6 mice (n = 5/group) were injected with ID8-OVA-Luc tumor cells (2 × 10⁶) intraperitoneally. Mice were treated with RA190 (10 mg/kg/day) beginning on day 11 for five consecutive days and again on day 18 for five consecutive days. (A–B) MDSCs were isolated from ascites at day23 and analyzed for P-Stat3, arginase, and iNOs expression by intracellular staining and flow cytometry. (A) Bar graph showing mean fluorescent intensity (MFI) of P-Stat3 in the tumor microenvironment of vehicle and RA190-treated groups. (B) Bar graph showing percentage of Arginase+ and iNOS+ MDSCs in the tumor microenvironment in various groups. (C–D) Ascites were collected from mice treated with vehicle or RA190 and flow cytometry was used to assess different T cell populations in the tumor microenvironment. (C) Bar graph showing the absolute number of CD8+IFNγ+ T cells in the tumor microenvironment. (D) Bar graph showing the absolute number of CD4+CD25+Foxp3+ T cells in the tumor microenvironment. Values are shown as mean ± SD (*P = 0.05, **P = 0.01, ns, not significant).
