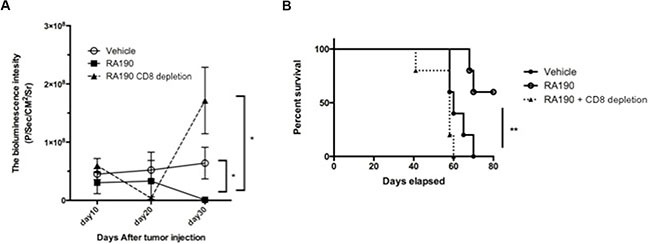
Figure 6. Role of CD8+ T cells in the antitumor effect of RA190 treatment.

Groups of ID8-OVA-Luc tumor-bearing mice (n = 5) were treated with vehicle or RA190 according to the similar schedule described in Figure 5. To deplete CD8+ T cells, a group of mice (n = 5) treated with RA190 were also injected intraperitoneally with anti-CD8 monoclonal antibody (100 μg/mouse) on days 11, 12 and 13 after tumor challenge and every other week subsequently. (A) Line graph showing tumor growth as measured by bioluminescence intensity in various treatment groups. (B) Kaplan–Meier survival analysis of mice in various treatment groups. Values are shown as mean ± SD (*P = 0.05, **P = 0.01, ns, not significant).
