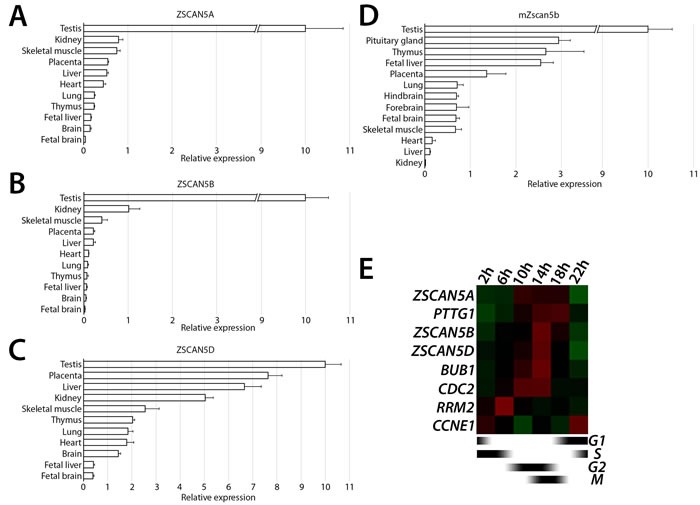
Figure 2. Tissue- and cell cycle stage-specific expression ZSCAN5 family genes.

Relative transcript levels measured in cDNA prepared from total tissue RNA for A. human ZSCAN5A, B. ZSCAN5B, C. ZSCAN5D, and paralogous gene for D. mouse Zscan5b by qRT-PCR. Relative expression in other tissues was normalized to expression level in testis, which was set as 10. Error bars correspond to the variance between experimental triplicates. E. Heat map showing the patterns of expression for ZSCAN5A, ZSCAN5B, and ZSCAN5D in HEK-293 cells collected at different times after release from a double thymidine block to synchronize cells at early S-phase. Expression levels of CCNE1, RRM2, CDC2, BUB1 and PTTG1 were measured on the same cDNA samples to monitor progression through the cell cycle.
