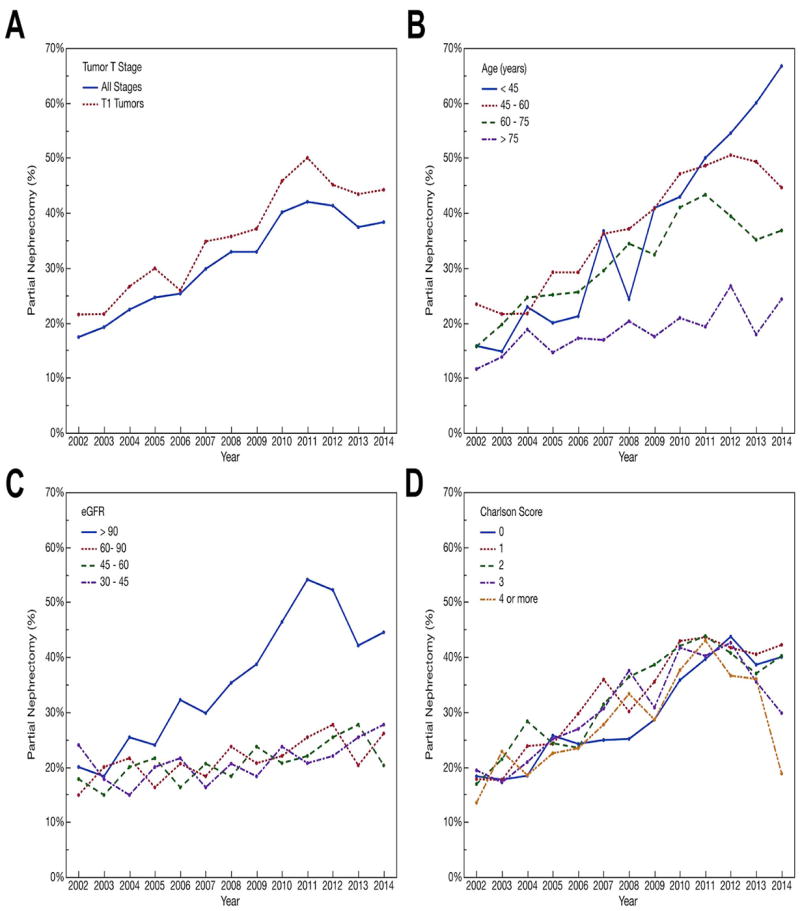
Figure 1.

A) The percentage of all patients (blue), and patients with T1 tumors (red), receiving partial nephrectomy each year. There was a steady increase in the utilization of partial nephrectomy over the study period. B) The percentage of patients receiving partial nephrectomy by year and age. Younger patients had the greatest increase in the proportion receiving partial nephrectomy. C) The percentage of patients receiving partial nephrectomy by year and pre-operative eGFR. Patients with the best pre-operative kidney function showed the greatest increase in proportion receiving partial nephrectomy. D) The percentage of patients receiving partial nephrectomy by year and Charlson score.
