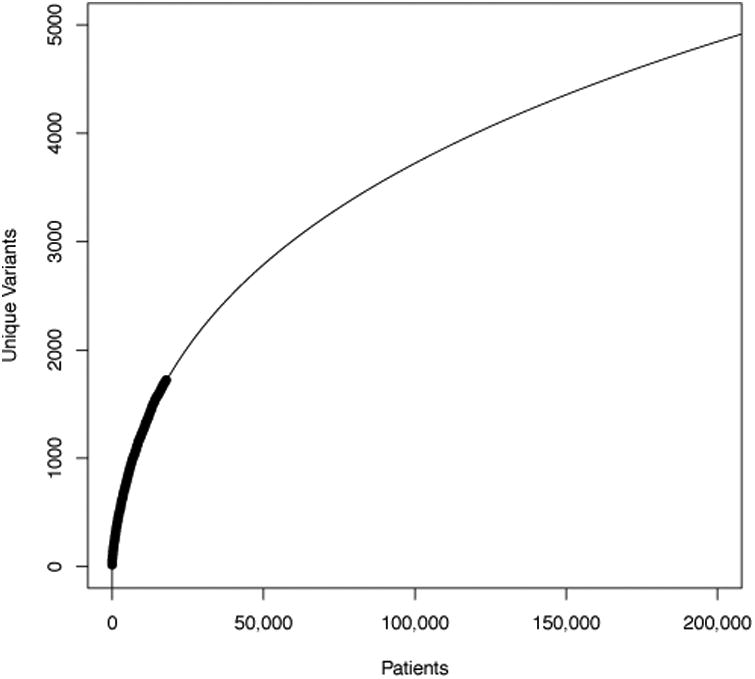
Figure 4.

The relationship of number of unique BRCA1/2 variants to number of patients tested at Invitae (dark curve). The extrapolation (light curve) was fit in R using the formula poly(log(Patients), 3). We chose the polynomial degree empirically by minimizing the Akaike Information Criteria [Sakamoto 1986].
