
Fig 1.
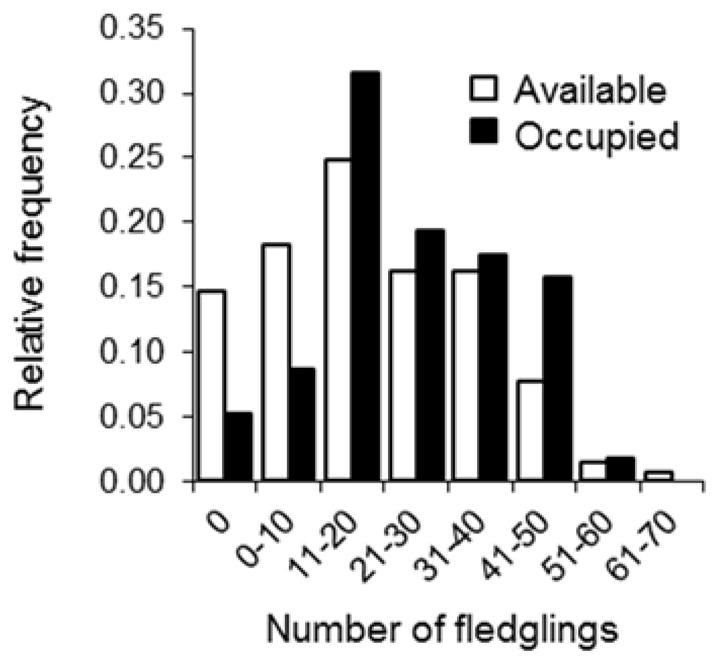
Variation in territory quality, quantified as the total number of fledglings produced at a given nesting site over the ten years prior to this study (open bars). Open bars depict variation in the relative success of birds breeding at available territories (N = 258 nesting sites) in previous years, and filled bars represent the frequency with which these nesting sites were occupied by birds in the present study (N = 57). The average number of total fledglings produced by a territory over the ten years prior to this study was 19.2 ± 0.9 (mean ± SE); thus, low-quality territories were under-occupied and high-quality territories were over-occupied ( , P = 0.015)