
Fig 5.
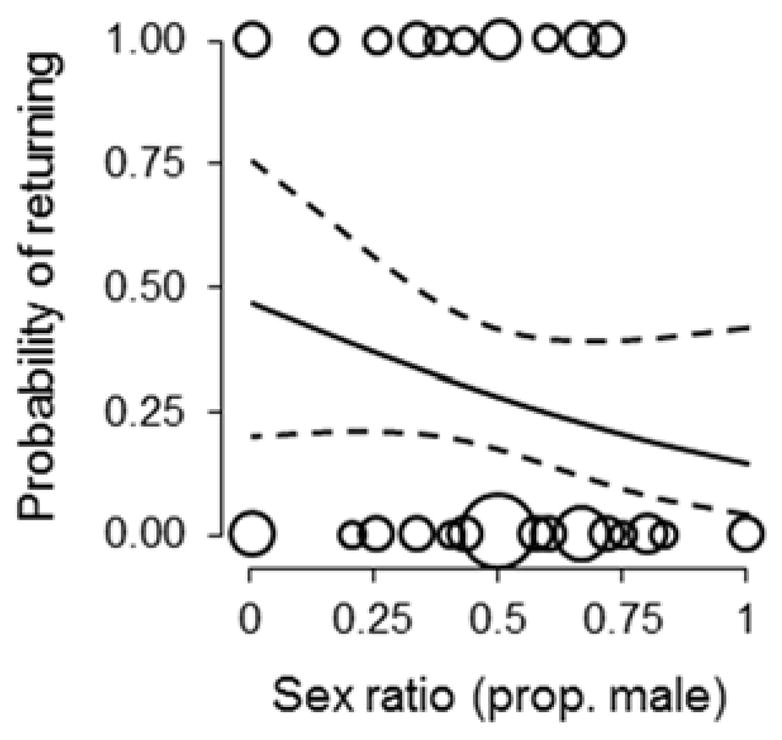
The probability that a given female would return to breed in the local population in subsequent years in relation to the brood sex ratio. Curves represent predictions from a generalized linear mixed model ± 95 % confidence limits. Points represent individual females (point size is proportional to the number of overlapping values)