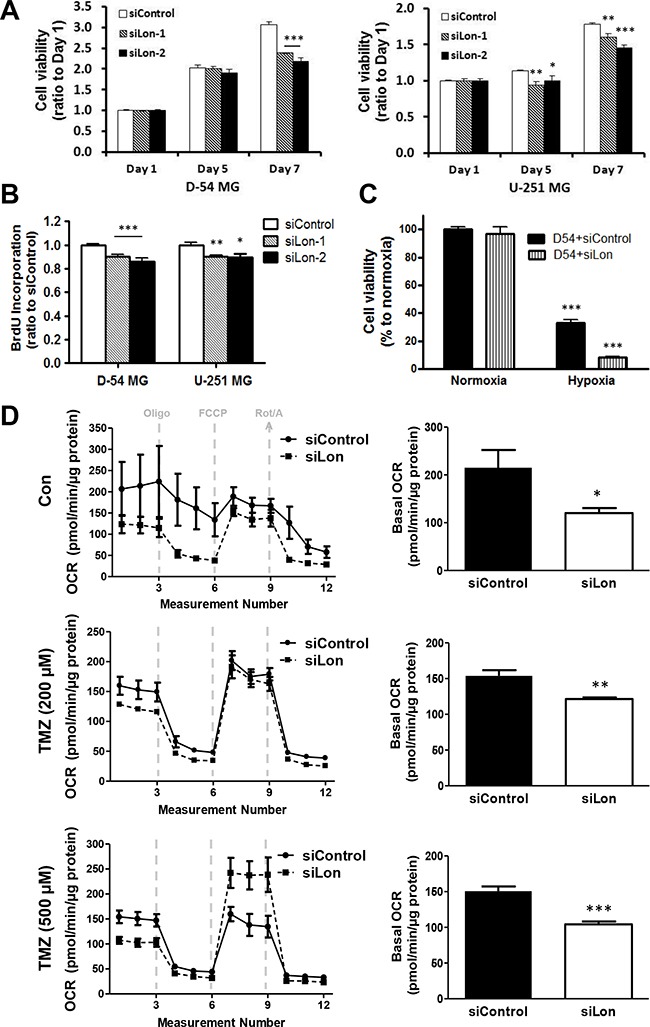
Figure 4. Effect of Lon knockdown on cell proliferation and mitochondrial respiration in glioma cells.

A. The growth rate of D-54 (left panel) and U-251 (right panel) cells transfected with siControl, siLon-1, and siLon-2 was measured by MTT assay. Data are presented as the ratio of the absorbance of transfected cells to that of untransfected (baseline) cells. B. The effect of Lon knockdown on cell proliferation was measured by BrdU incorporation analysis. C. D-54 cells were transfected with siLon-1. After 24 hours, cells were then subjected to hypoxia (1% O2) for 48 hours, and cell viability was measured by MTT assay. D. Mitochondrial respiratory profile of D-54 cells transfected with siLon-1. Twenty-four hours after transfection, cells were plated on Seahorse XF24 cell culture microplates, and treated with 200 μM or 500 μM of TMZ for 5 days. After establishing a basal OCR, oligomycin (2 μM), FCCP (0.5 μM), and rotenone (1 μM) plus antimycin A (1 μM) were sequentially added (left panel). The basal OCR was calculated using the difference between baseline and oligomycin treatment (right panel). Data graphed as mean ± SEM, n=3 per treatment group. *p < 0.05, **p < 0.01, ***p < 0.001.
