
Figure 7. FOXM1 expression and STAT3 activation are mutually co-regulated under RT.
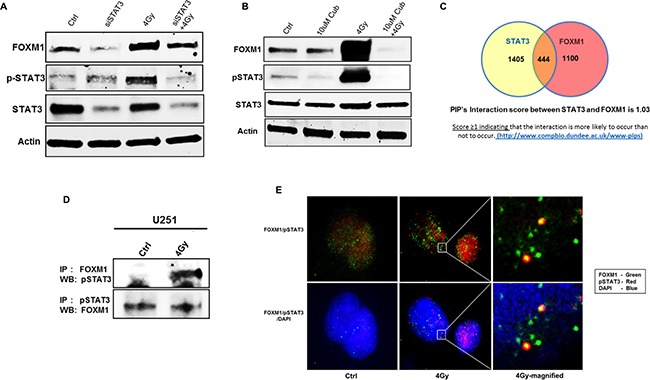
Panels A, B. represent immunoblots (for FOXM1, total STAT3, phopho STAT3) of lysates prepared from siRNA mediated inhibition of STAT3 (A) and STAT3 inhibitor (Cucurbutacin-I) (B) as indicated. Panel C. represents the Venn diagram of no of interacting molecules among and between FOXM1 and STAT3 along with their predicted PIP's interaction score. Co-immunoprecipitation immunoblots are represented in panel D. for FOXM1 and pSTAT3 interaction and co-localization in the nucleus represented by Immunofluorescence images in panel E. FOXM1(green), pSTAT3(red), nuclear stain -(blue). Data presented is representative of three independent experiments.