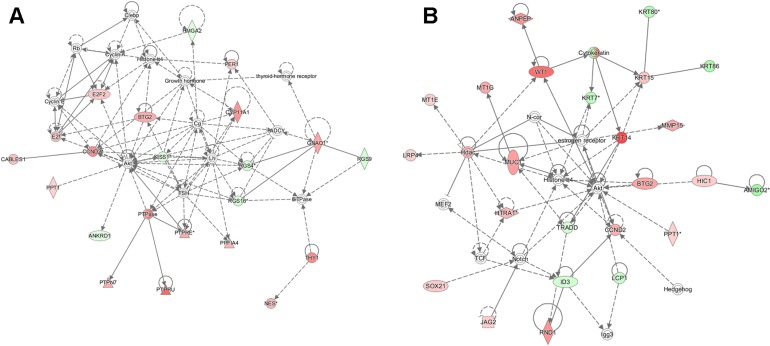
Figure 4. Functional network maps for SIN3 regulated genes.
Ingenuity pathway analysis (IPA) was utilized to generate functional network maps for the top altered genes following knockdown of SIN3A (A) and SIN3B (B). Red indicates genes that are up-regulated, green indicates genes that are down-regulated, and white indicates genes that are incorporated into the network through relationships with other genes. The intensity of color indicates the degree of up- or down-regulation. Shapes indicate the type of molecule: horizontal ovals are transcription regulators, vertical ovals are transmembrane receptors, diamonds are enzymes, triangles are phosphatases, double circles are part of complexes or groups, dotted squares are growth factors, and circles are listed as other.

