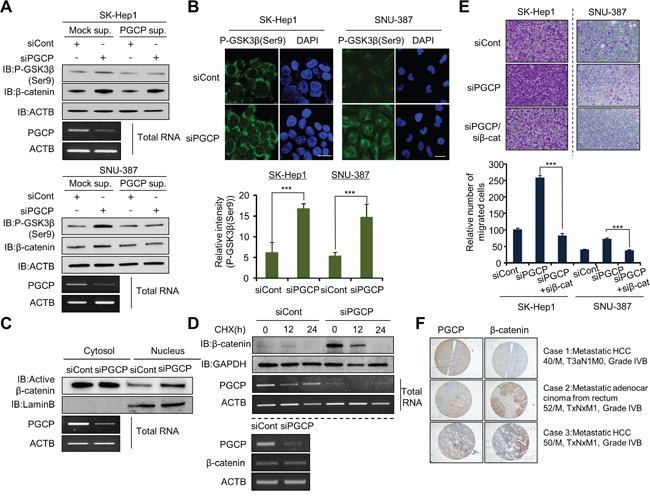
Figure 2. PGCP knockdown increases phosphorylation of GSK3β.

A. Western blot analysis of phospho-GSK3β (Ser9) and β-catenin. PGCP supernatant was added to cultured SK-Hep1 and SNU-387 cells treated with siCont or siPGCP. Whole cell lysates were prepared and analyzed by western blotting using the indicated antibodies. ACTB was used as a loading control. B. Immunofluorescence of phospho-GSK3β (Ser9). The cells treated with siCont or siPGCP were fixed with methanol and stained with anti-phospho-GSK3β (Ser9) (Alexa Fluor 488, green) antibody and DAPI (blue). Scale bar, 20 μm. The signal intensities corresponding to phospho-GSK3β (Ser9) were quantified using the ImageJ software (bottom). The p values were calculated using Student's t-test (***p<0.001. C. Western blot analysis of β-catenin. The whole cell lysates were prepared form SK-Hep1 cells treated with siCont or siPGCP and separated into nuclear or cytosolic fractions using a nuclear and cytoplasmic extraction reagent (NE-PER, Thermo). The purity of cell fractionation was monitored by Lamin B. D. Detection of PGCP and β-catenin by Western blotting and RT-PCR. Top, Cells were treated with 100 μg/ml of cycloheximide (CHX) for the indicated times and immunoblotted to examine β-catenin levels after treatment with siCont or siPGCP. Anti-GAPDH antibody was used as an internal control. Bottom, The expression level of PGCP and β-catenin was measured by semi-quantitative RT-PCR after PGCP depletion in SK-Hep1 cells. ACTB was used as an internal control. E. Cell migration assays in SK-Hep1 and SNU-387 cells. After 24 h, migrated cells were fixed with methanol and stained with crystal violet. The p value was calculated using Student's t-test (***p<0.001). F. Inverse correlation between expression of PGCP and β-catenin in human liver cancer tissues. Immunohistochemical analysis of PGCP and β-catenin. Liver cancer samples were purchased from SUPER BIO CHIPS. Negative correlation of staining between PGCP and β-catenin was calculated using Spearman's correlation coefficient by ranks with ties.
