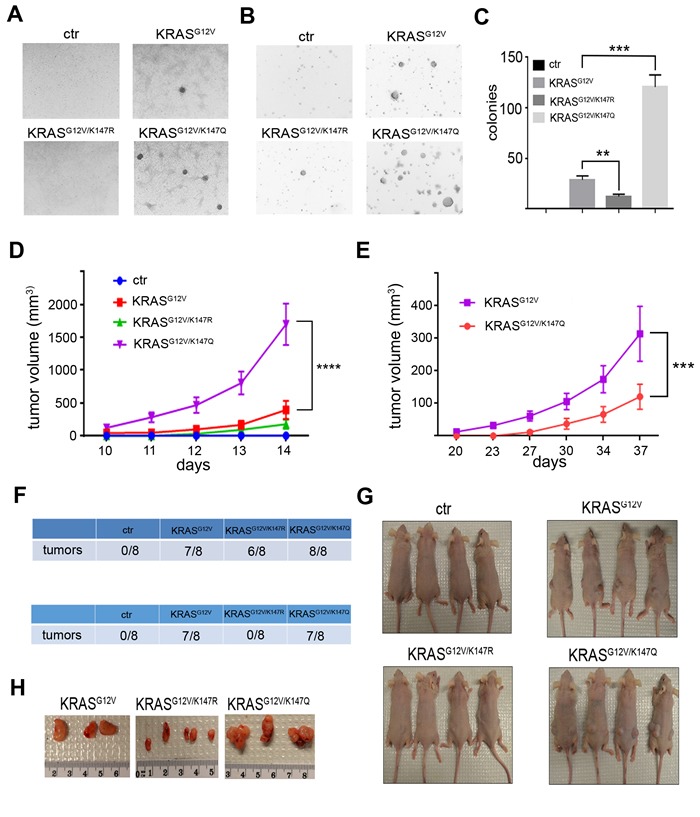
Figure 4. K147 acetylation status regulates KRAS transformative properties.

A., B. Transforming activity of NIH3T3 cells expressing KRAS, KRAS and KRAS after knocking down endogenous Kras was checked by testing colonies formed when cells were grown under confluency (A) and in soft agar (B). C. Quantification of data in panel (B) is shown. Data represent the mean ± SD of three independent experiments, **p < 0.01 KRASvs KRAS cells, ***p < 0.001 KRASvs KRAS cells. D. NIH3T3 cells expressing KRAS, KRAS and KRAS after knocking down endogenous Kras were injected subcutaneously into nude mice, and tumor growth was monitored by measuring tumor volume (n = 8 tumor injections were performed for each cell line). Data represent mean ± SEM, ****p < 0.0001 KRASvs KRAS tumors. E. Kras MEFs infected with lenti-KRAS, lenti-KRAS and lenti-KRAS followed by treatment with 4HT were injected subcutaneously into nude mice, and tumor growth was monitored by measuring tumor volume (n = 8 tumor injections were performed for each cell line). Data represent mean ± SEM, ***p < 0.001 KRASvs KRAS tumors. F. Number of tumors formed in nude mice injected with NIH3T3 cells expressing KRAS, KRAS and KRAS after knocking down endogenous Kras (upper) and Kras MEFs infected with lenti-KRAS, lenti-KRAS, and lenti-KRAS followed by treatment with 4HT (lower). G. Characteristic images of mice bearing the subcutaneous tumors after injecting the different cells. H. Subcutaneous tumors were removed after sacrificing the mice, and characteristic images of the tumors are shown.
