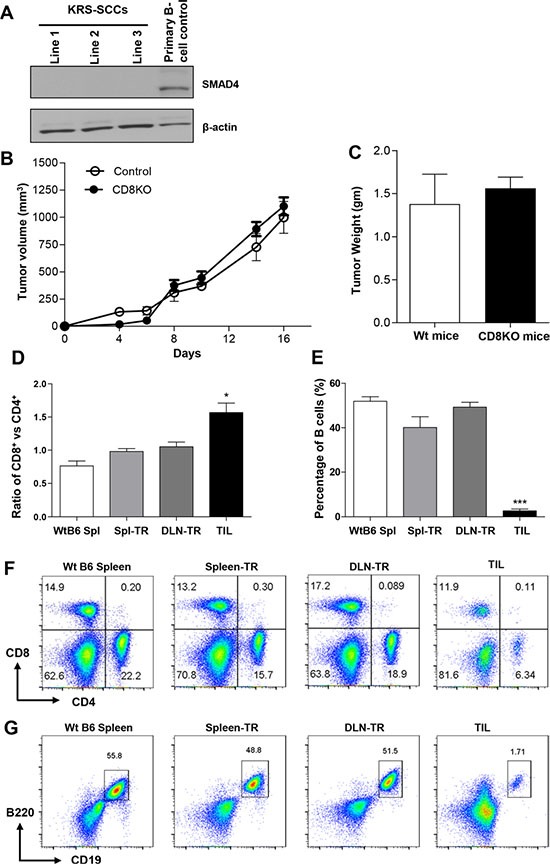
Figure 1. SCCs escape CD8+ T cell-mediated immune surveillance and immune profiling of TILs in KRS-SCCs.

(A) The absence of SMAD4 protein was confirmed in three KRS-SCC lines by western blot with primary B cells as positive control and β-actin as loading control. (B) KRS-SCC tumor cells were injected into wt or CD8−/− recipients individually. Tumor volume was monitored in wt (Control, n = 12) and CD8−/− recipients (CD8KO, n = 12). The tumor growth curve is not significantly different between two groups. (C) Tumor weight was measured at the end of experiments from = wt (wt mice, n = 12, white bar) or CD8−/− recipients (CD8KO mice, n =12, black bar). Representative data are shown from four independent experiments. (D) Ratio of CD8+ vs CD4+ T cells in CD45+ population in different groups. WtB6-spl (n = 3), Spl-TR (n = 6), DLN-TR (n = 6) and TIL (n = 12). (E) Percentage of B cells in CD45+ population in different groups. WtB6-spl (n = 3), Spl-TR (n = 6), DLN-TR (n = 6) and TIL (n = 12). (F and G) Representative FACS plots are shown for CD8 vs CD4 (F) or B220 vs CD19 (G) staining in different groups. WtB6-spl: splenocytes isolated from wt naïve B6 mice; Spl-TR: splenocytes isolated from tumor recipients; DLN-TR: draining lymph node cells isolated from tumor recipients. TIL: tumor infiltrating lymphocytes. Data are presented as mean ± s.e.m. Data are representative results of 3 different cell lines in total 7 independent experiments for panel D-G (see details in Supplemental Table S1). Statistical significance was calculated with One-way ANOVA, Tukey's Multiple comparison test (Graphpad Version 5.01) among different groups, *P ≤ 0.05, ***P ≤ 0.001.
