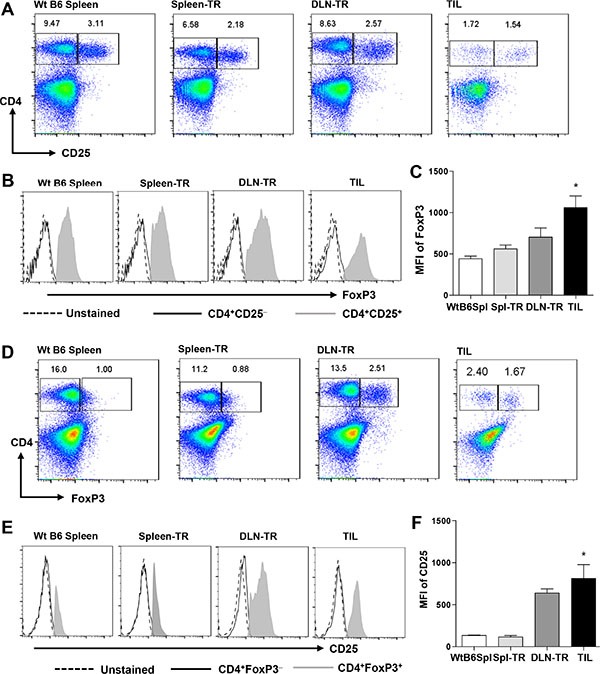
Figure 4. A preferential expansion of Tregs in CD4+ TILs.

Representative FACS plots are shown for CD4 vs CD25 (A) or CD4 vs FoxP3 (D) staining in different groups. Representative histogram plots are shown for FoxP3 (B) or CD25 (E) staining gated on different subsets of CD4+ T cells as indicated. (C and F) Mean Fluorescence Intensity (MFI) for FoxP3 staining in gated CD4+CD25+ cells (C), and for CD25 staining in gated CD4+FoxP3+ cells (F) in different groups. WtB6-spl (n = 3), Spl-TR (n = 6), DLN-TR (n = 6) and TIL (n = 12). Data are presented as mean ± s.e.m. Statistical significance was calculated with Student's t-test (Graphpad Version 5.01) between Spl-TR and TIL, *P ≤ 0.05. Data are representative results of 7 independent experiments.
