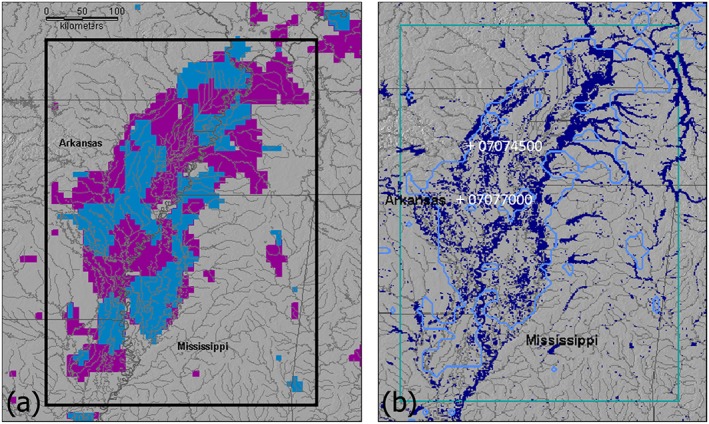
Figure 1.

Mississippi wetlands observed by (a) QuikSCAT WSE for weekly change monitored in the week ending 9 November 2002 (magenta) with respect to the largest in the week ending 2 February 2002 (blue, much of which is beneath the magenta) and (b) by MODIS as an inventory compiled over time (right). The rectangle defines the study area.
