
Figure 2.
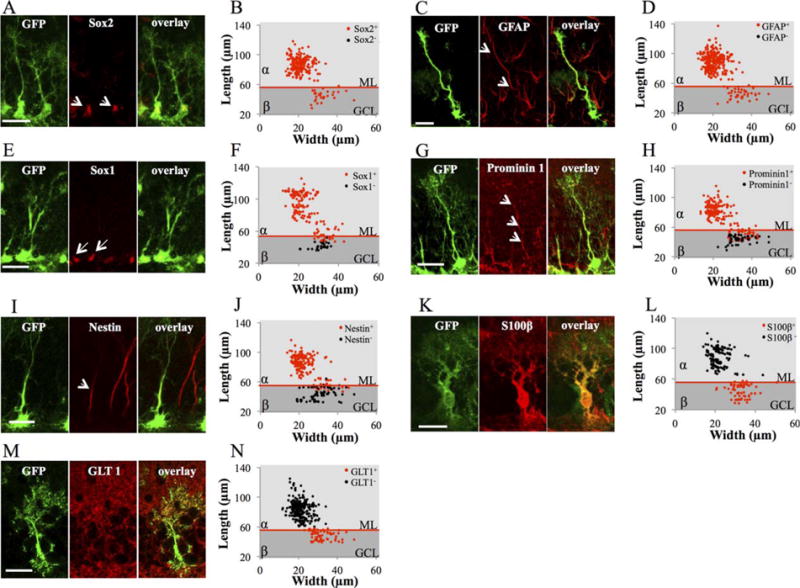
Molecular marker expression of type α and type β cells. (A): Confocal maximal projection micrographs of glial fibrillary acidic protein (GFAP)-green fluorescent protein (GFP) radial glia-like (RGL) cells (green), immunostained for Sox2. (B) Scatter graphs representing the dimensions of RGL cells immunostained for Sox2. (C): Confocal maximal projection micrographs of GFAP-GFP RGL cells (green), immunostained for GFAP. (D): Scatter graphs representing the dimensions of RGL cells immunostained for GFAP. (E): Confocal maximal projection micrographs of GFAP-GFP RGL cells (green), immunostained for Sox1. (F): Scatter graphs representing the dimensions of RGL cells immunostained for Sox1. (G): Confocal maximal projection micrographs of GFAP-GFP RGL cells (green), immunostained for Prominin1. (H): Scatter graphs representing the dimensions of RGL cells immunostained for Prominin1. (I): Confocal maximal projection micrographs of GFAP-GFP RGL cells (green), immunostained for Nestin. (J): Scatter graphs representing the dimensions of RGL cells immunostained for Nestin. (K): Confocal maximal projection micrographs of GFAP-GFP RGL cells (green), immunostained for S100β. (L): Scatter graphs representing the dimensions of RGL cells immunostained for S100β. (M): Confocal maximal projection micrographs of GFAP-GFP RGL cells (green), immunostained for GLT1. (N): Scatter graphs representing the dimensions of RGL cells immunostained for GLT1. Scale bars = 20 μm. Abbreviations: GCL, granule cell layer; GFAP, glial fibrillary acidic protein; GFP, green fluorescent protein; ML, molecular layer.