
Figure 3.
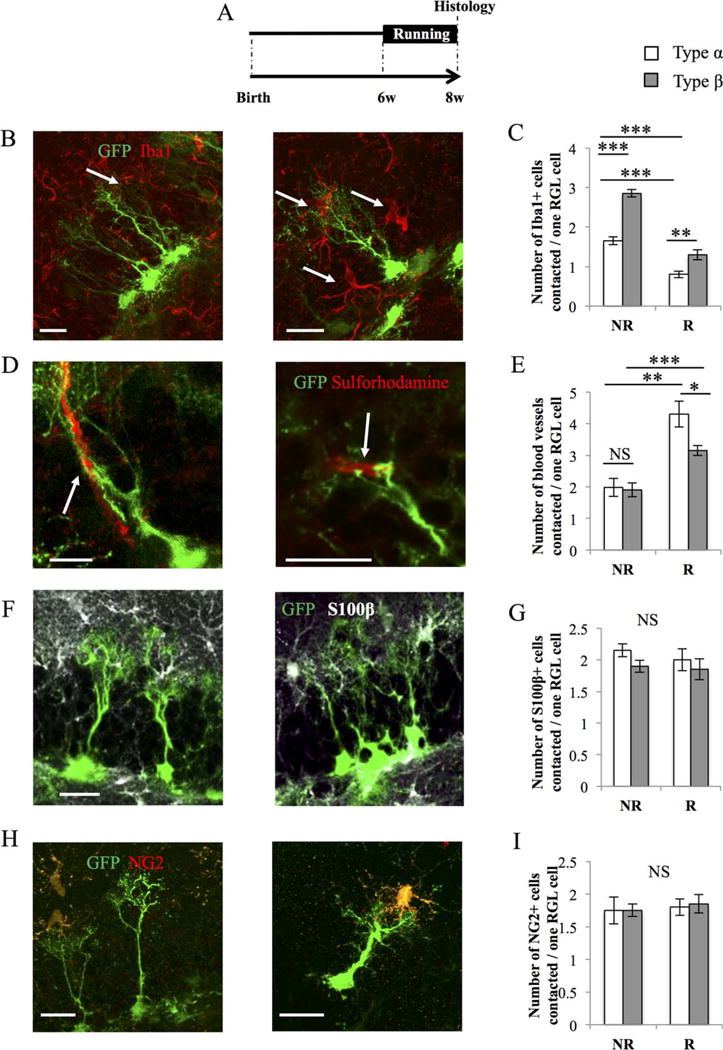
Type α and β cells contact niche-forming cells. (A): Experimental timeline. GFAP-GFP mice were housed in normal cages (NR) or in cages containing a running wheel (R) for 2 weeks before histological analysis. (B): Confocal maximal projection micrographs of radial glia-like (RGL) cells (green) and Iba1-immunostained microglia (red). (C): Histogram of the average number of microglia cells contacted per RGL cell. Type β cells contact more microglia than type α cells (one-way analysis of variance [ANOVA] F(3, 15) = 73.12; p < 0.001. Post hoc bilateral Student’s t test: No Run [type α vs. type β] p < 0.001, Run [type α vs. type β] p < 0.01). Two weeks of running decrease the interaction of microglia with both types α and β cells (post hoc bilateral Student’s t test: type α [No Run vs. Run] p < 0.001, type β [No Run vs. Run] p < 0.001). (D): Confocal maximal projection micrographs of RGL cells (green) and blood vessels, identified with Sulforhodamine (red). (E): Histogram of the number of blood vessels contacted per RGL stem cell. In sedentary mice, there is no difference between type α of a type β cell in sedentary conditions (one-way ANOVA F(3, 15) = 16.10; p < 0.001. Post hoc bilateral Student’s t test: No Run [type α vs. type β] p = 0.84). In running mice, blood vessel are more contacted by type α than type β cells (post hoc bilateral Student’s t test: Run [type α vs. type β] p < 0.05). Running, significantly increased the number of blood vessels contacted by both cell types (one-way ANOVA F(3, 15) = 16.10; p < 0.001. Post hoc bilateral Student’s t test: type α [No Run vs. Run] p < 0.001, type β [No Run vs. Run] p < 0.01). (F): Confocal maximal projection micrographs of RGL cells (green) and S100β-immunostained astrocytes (white). (G): Histogram of the number of astrocytes contacted per type α or type β cells. (H): Confocal maximal projection micrographs of RGL cells (green) and NG2-immunostained oligodendrocyte precursors cells (red). (I): Histogram of the number of oligodendrocyte precursor cells contacted by types α or β cells. Scale bars = 20 μm. N = 4 animals per group. Each value represents the mean ± SEM. *, p < 0.05; **, p < 0.01; ***, p < 0.001. Abbreviations: GFP, green fluorescent protein; RGL, radial glia-like.