
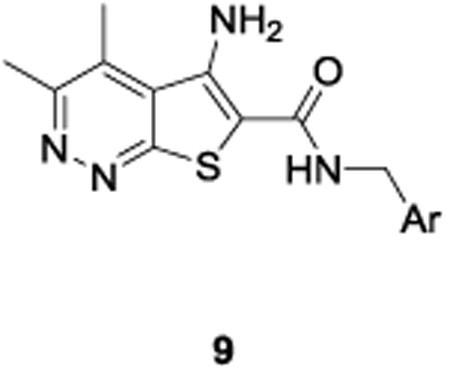
Table 1.
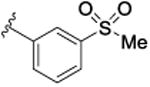
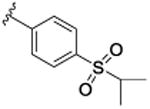
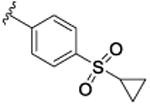
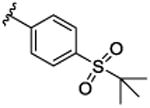
Structures and activities for rat M4 PAM 5 and analogs 9.
| ||||
|---|---|---|---|---|
| Cpd | Ar | rM4EC50 (nM)a[% ACh Max ±SEM] | rM4 pEC50 (±SEM) | Rat Kp(Kp,uu)b |
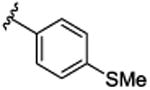
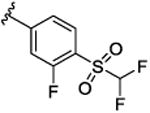
| 9a |
|
11.2 [75.6±1.7] | 7.95±0.09 | 0.13 (0.48) |
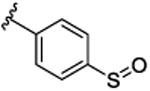
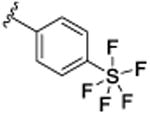
| 9b |
|
139 [74.2±1.9] | 6.86±0.04 | ND |
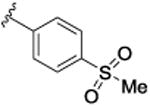
| 9c |
|
51.3 [72.6±2.2] | 7.29±0.08 | 0.04 (0.14) |
| 9d |
|
417 [74.6±2.1] | 6.38±0.17 | ND |
| 9e |
|
47.9 [76.8±2.7] | 7.32±0.06 | 0.07 (0.67) |
| 9f |
|
22.4 [67.1±3.1] | 7.65±0.05 | 0.05 (0.29) |
| 9g |
|
44.7 [72.1±2.2] | 7.35±0.06 | 0.11 (0.34) |
| 9h |
|
57.7 [69.2±3.5] | 7.24±0.10 | 0.51 (2.8) |
| 9i |
|
21.9 [62.5±5.5] | 7.66±0.04 | BLQ |
| 9j |
|
17.8 [65.2±2.4] | 7.75±0.14 | 0.11 (0.10) |
| 5 |
|
17.8 [68.1±1.6] | 7.75±0.06 | 0.49 (1.1)c |
| 9k |
|
23.4 [76.7±2.6] | 7.63±0.05 | BLQ |
| 9l |
|
30.2 [75.7±1.6] | 7.52±0.03 | 1.4 (1.0) |
a
Calcium mobilization assays with rM4/Gqi5-CHO cells performed in the presence of an EC20 fixed concentration of acetylcholine; values represent means from three (n=3) independent experiments performed in triplicate.
b
Total and calculated unbound brain:plasma partition coefficients determined at 0.25 hr post-administration of an IV cassette dose (0.20-0.25 mg/kg) to male, SD rat (n=1); in conjunction with in vitro rat plasma protein and brain homogenate binding assay data. ND = not determined. BLQ = below limit of quantitation.