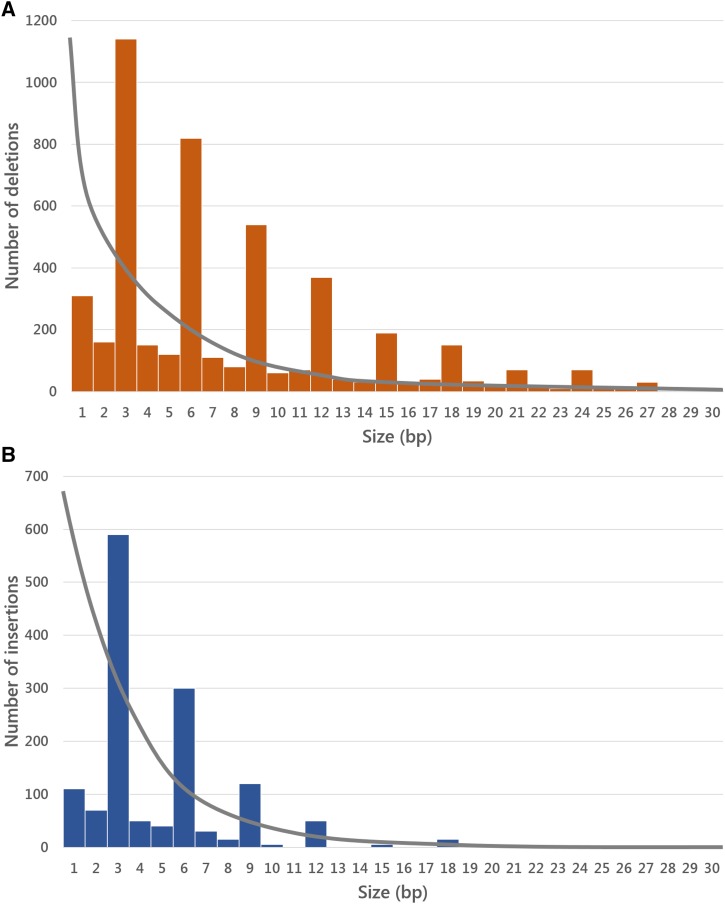
Figure 4.
The footprint of deleterious selection on indel variation. Indel size distribution of (A) deletions and (B) insertions in coding regions (bars) and short introns (for comparison, gray line). The size distribution of indels in coding regions has discrete peaks for indel sizes in multiples of 3 bp. This remarkable pattern is a classroom example of the footprint that natural selection against frameshifting indels leaves, compared to a more relaxed selection for insertions and deletions spanning complete codons or short introns. Data from Massouras et al. (2012) and Huang et al. (2014).

