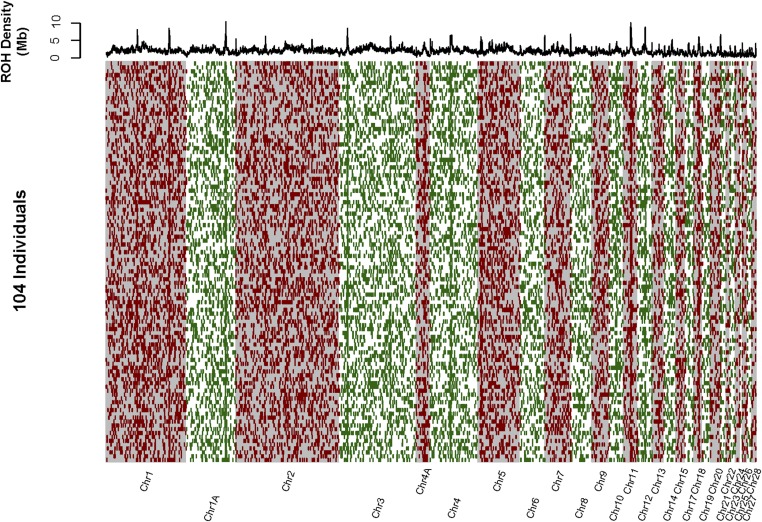
Figure 3.
The physical mapping of all long (>50 kb) IBD segments in 104 Baltic collared flycatchers. Chromosomes are arranged left to right (alternating gray and white background). The 104 individuals are represented in rows. IBD segments are represented as red and green bars across each individual’s genome. The density of IBD segments across all individuals is represented in the top panel as the sum of the lengths of all overlapping IBD segments in nonoverlapping 200-kb windows.

