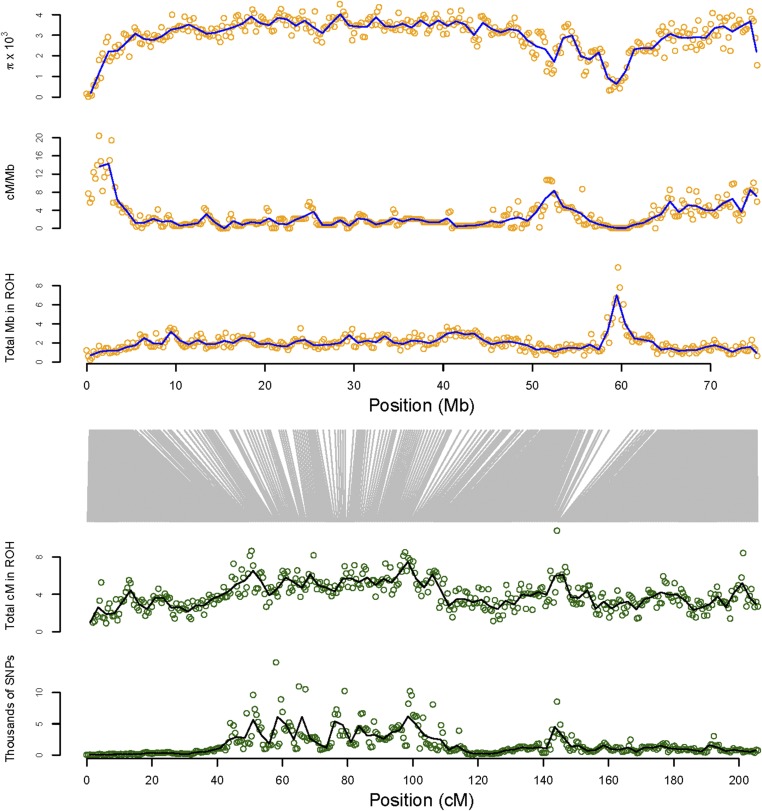
Figure 5.
Map of ROH, recombination rate, and estimates of genetic diversity across chromosome 1A from 104 Baltic collared flycatchers. The top three panels (orange points) show nucleotide diversity (π), recombination rate (cM/Mb), and the density of ROH physically mapped in nonoverlapping 200-kb windows. The bottom two panels show the density of ROH and the number of SNPs (thousands) genetically mapped in nonoverlapping 0.5-cM windows. The vertical gray lines translate the center points of the 0.5-cM windows in the lower two panels to the corresponding physical positions in the three upper panels.

