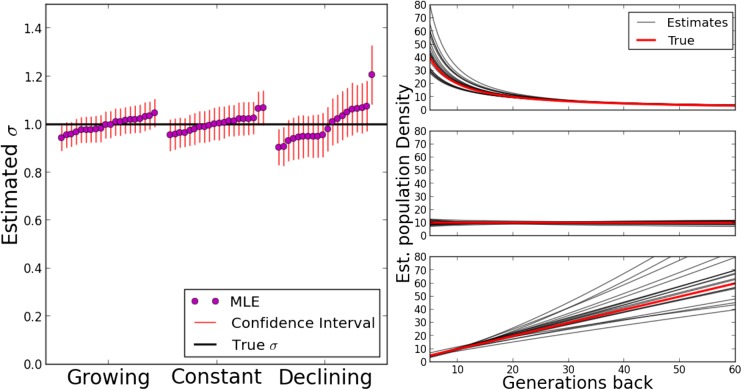
Figure 6.
Likelihood estimates for various population density scenarios. The same scenarios used in Figure 4 were simulated. For 20 runs each, 625 chromosomes of length 150 cM were randomly picked from a sample grid and traced back using a Laplace dispersal kernel with and the maximum likelihood fits and confidence intervals were calculated from their block sharing. For the estimated population density, the true value of the simulations and the maximum likelihood estimate for every run are shown. MLE, maximum likelihood estimate.

