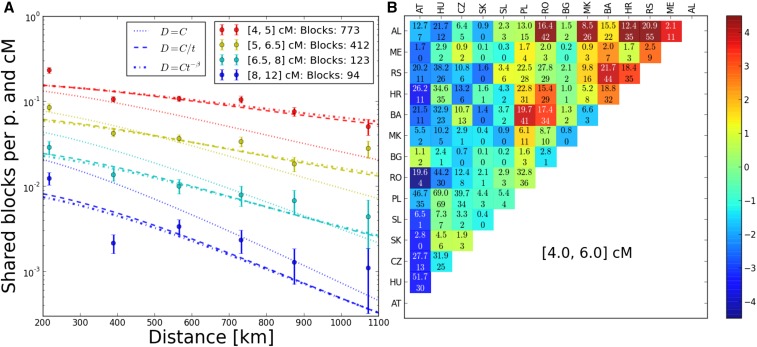
Figure 8.
Fit of models to Eastern European block-sharing data. (A) To better visualize the data, observed block sharing was binned into distance and block length bins. The •’s depict the average block sharing within each bin and the lines are predictions from the best fit models. The error bars represent SDs under the assumption of Poisson counts in every bin; some are clearly too tight and there are outliers, which hints at more systematic deviations at the country-pair level (see also Figure 5). p., pair. (B) Residuals for pairs of countries for blocks of length 4–6 cM. Upper line in every field: total number of IBD blocks predicted by the best fit model. Lower line: observed number of IBD blocks. Color of every field is determined by statistical significance (z-value when transformed AL, Albania; AT, Austria; BA, Bosnia; BG, Bulgaria; CZ, Czech Republic; HR, Croatia; HU, Hungary; ME, Montenegro; MK, Macedonia; PL, Poland; RO, Romania; RS, Serbia; SK, Slovakia; SL, Slovenia.

