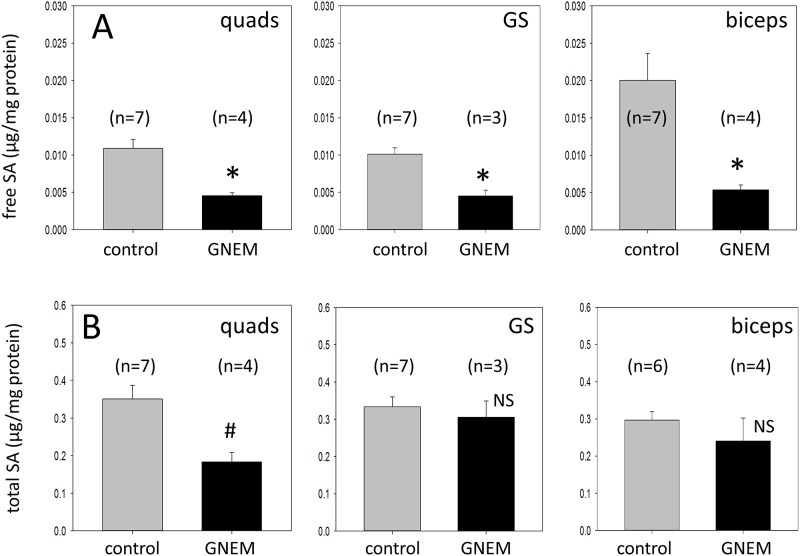
Fig 5. Free and total SA levels of wild-type controls and GneM743T/M743T mice according to muscles.
A) Free SA data in both littermate controls and GneM743T/M743T mice. * -indicates a statistical significant difference with a p = 0.006 for quadriceps (quads), p = 0.005 for gastrocnemius (GS), p = 0.006 for biceps. B) Total SA data in both littermate controls and GneM743T/M743T mice. # -indicates a statistical significant difference with a p = 0.01 for quadriceps (quads). NS denotes not statistically significant. Free and total SA values were corrected for protein (μg SA/mg protein).

