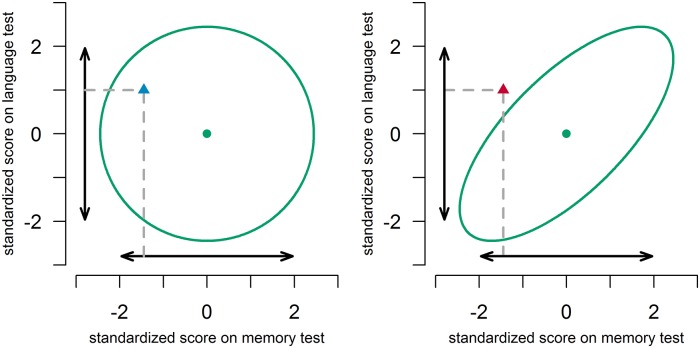
Fig 1. Illustration of multivariate normative comparisons in a situation with scores on two neuropsychological tests.
The double-headed arrows denote the 95% univariate intervals. The ellipses denote the 95% multivariate region. The dots denote the mean score in the norm group. The triangles depict a patient’s scores. In the left panel, tests are uncorrelated (r = 0.0). In the right panel, tests are correlated (r = 0.7).

